What do APN readers think about Prop Q?
The results of the APN poll!

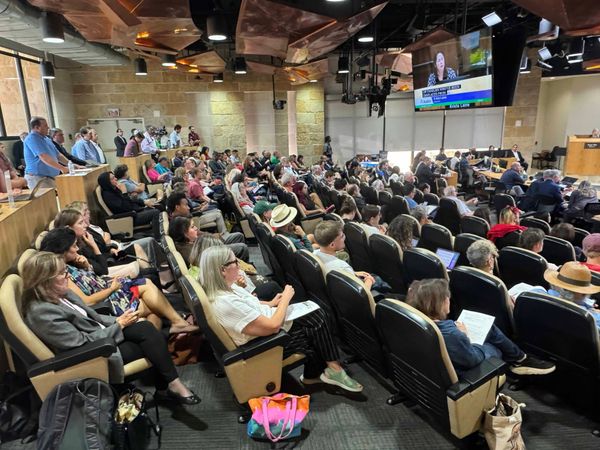
Yesterday I invited you to take a survey on Prop Q. I am very grateful to the 317 of you who took 17 seconds out of your day to complete it. To the more than 600 of you who opened the email but didn't take the poll ... I don't get it. How can you resist taking a poll? I swear it's anonymous!
Without further ado:
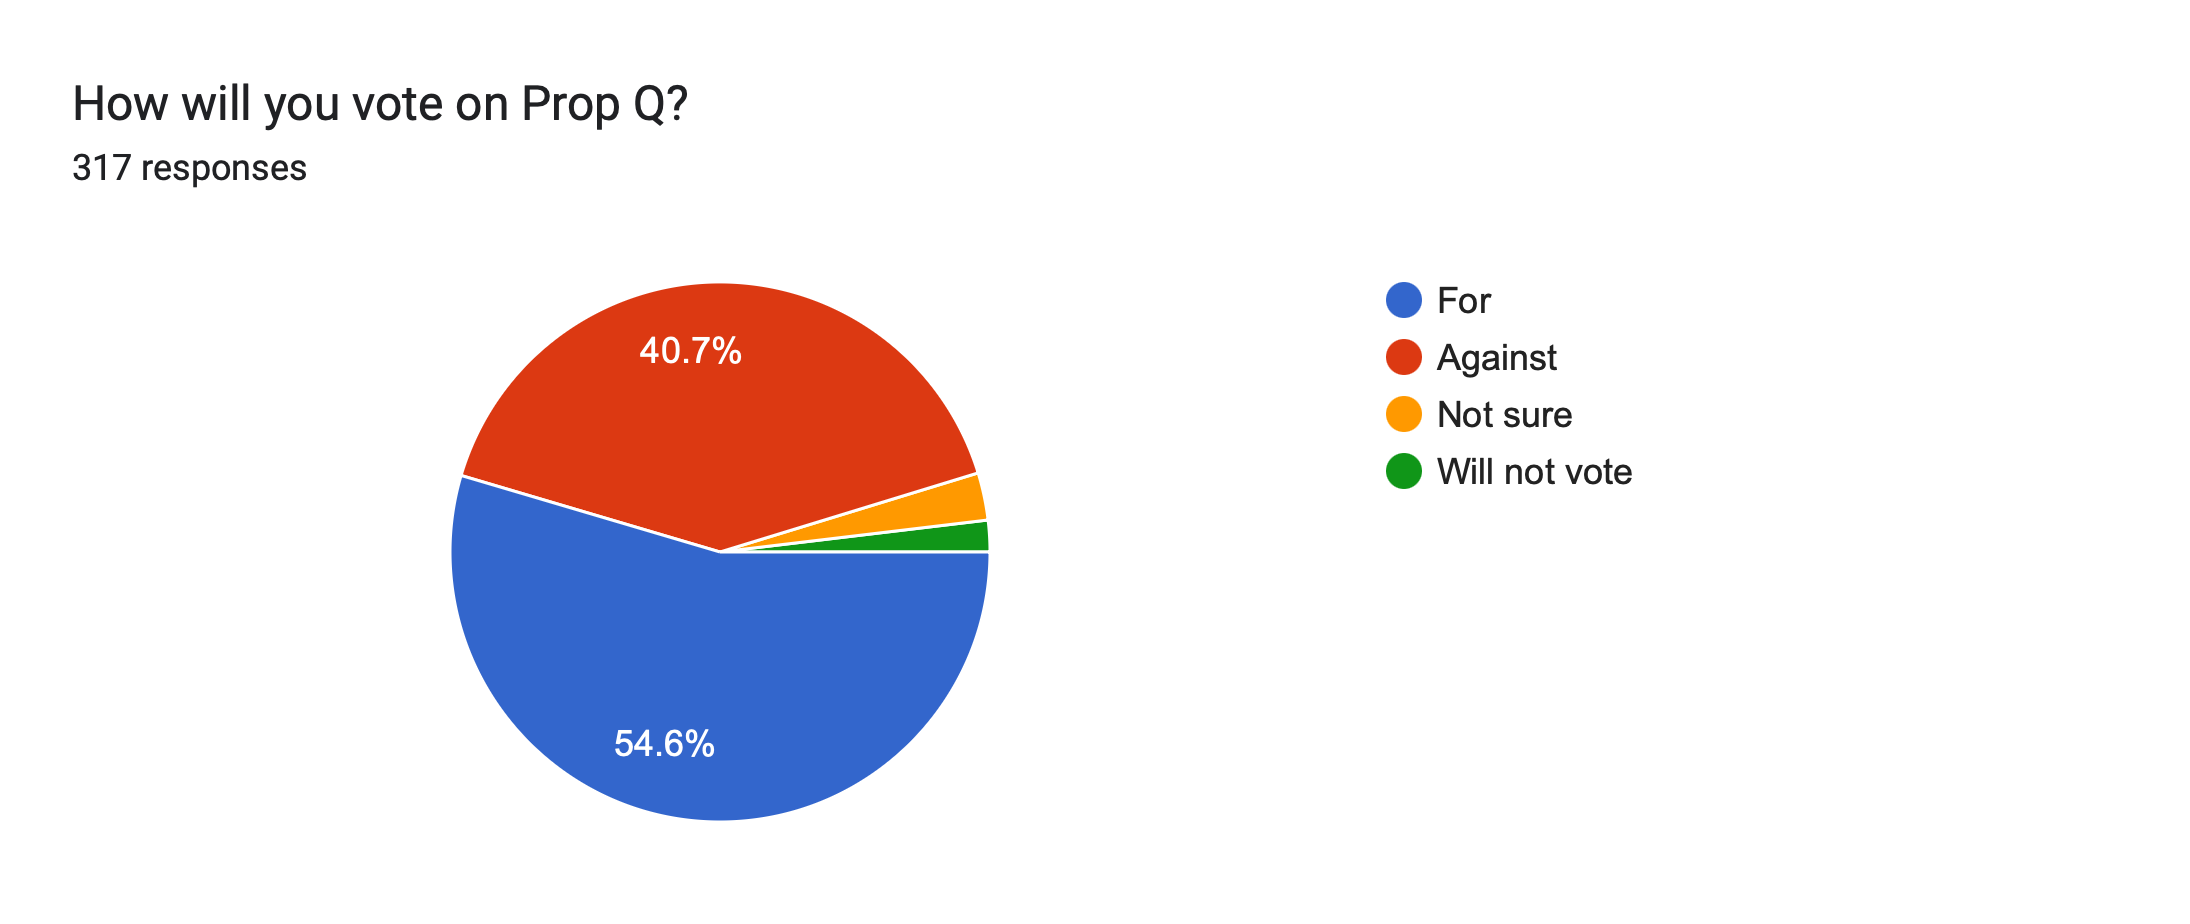
Among respondents, 54.6% say they will vote in support of Prop Q, 40.7% say they will vote against, 2.8% say they are not sure, and 1.9% say they will not vote.
Is that a good omen for Prop Q? No, I don't think so.
The next result shows why:
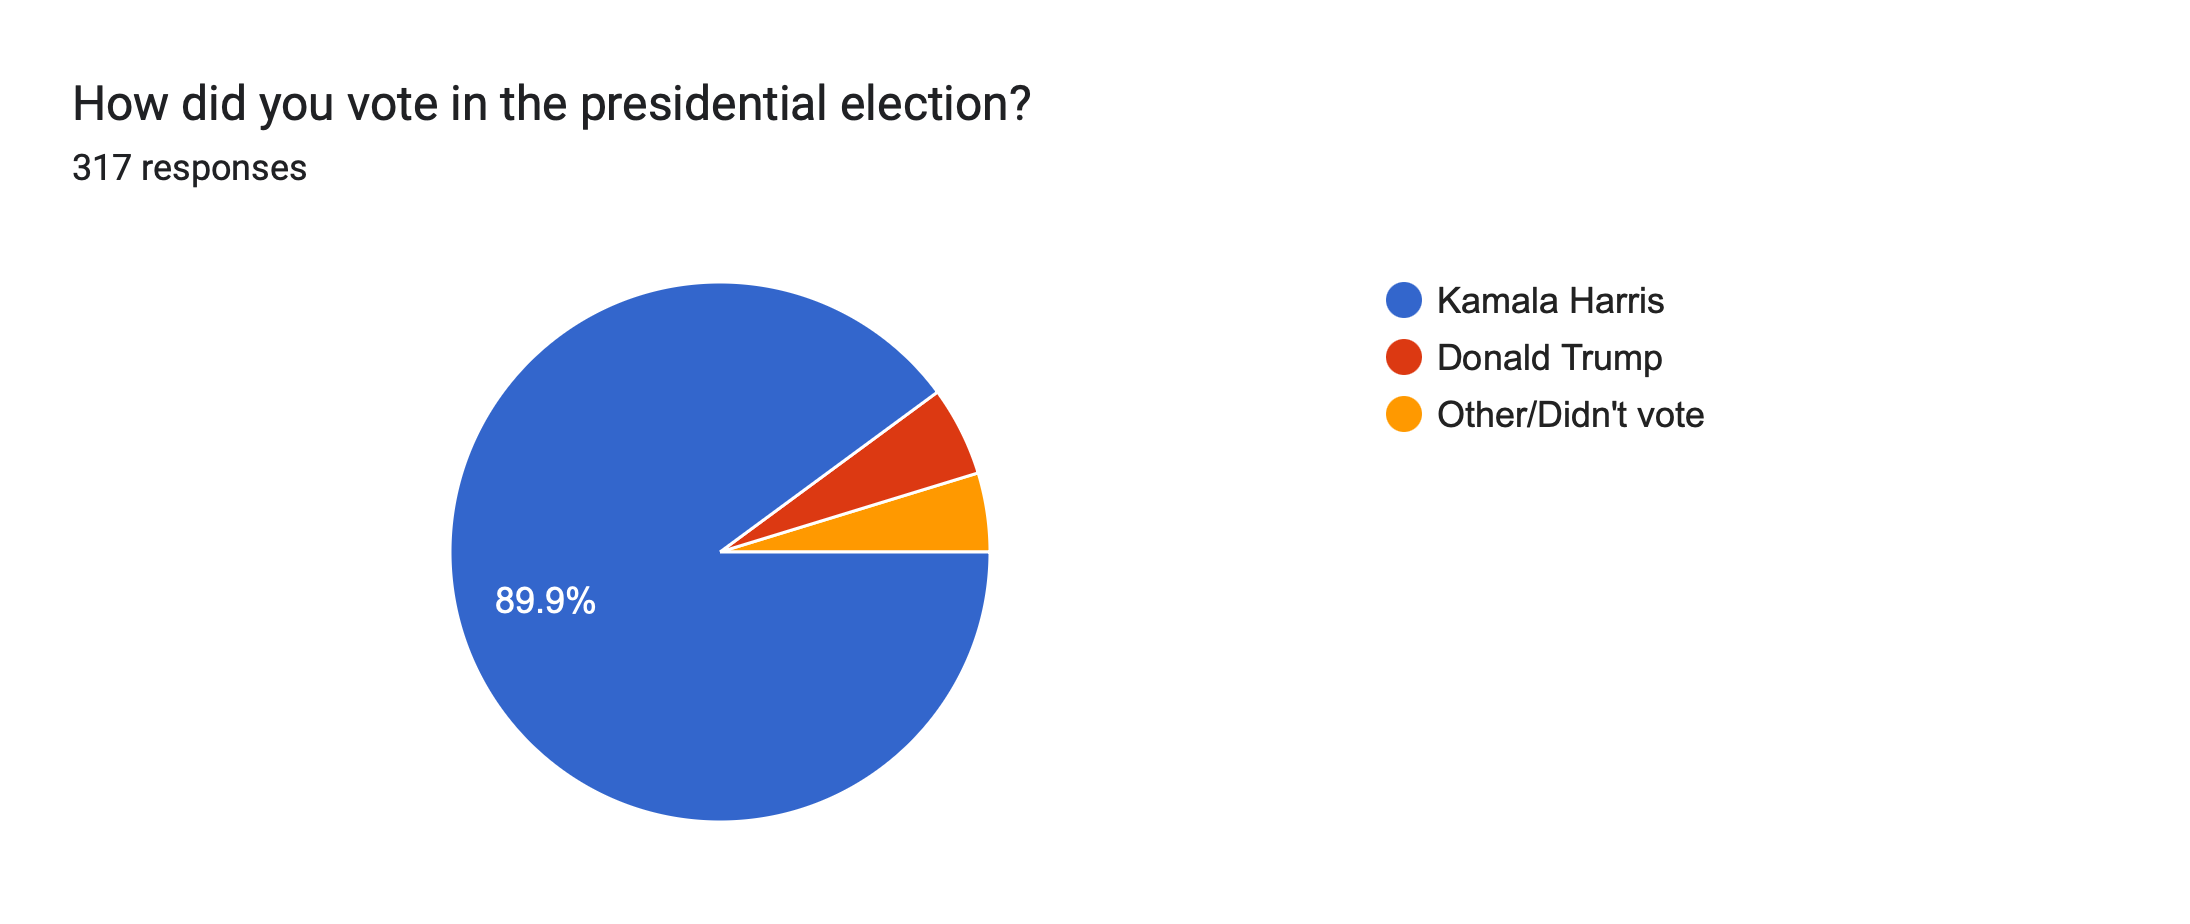
89.9% of these respondents voted for Kamala Harris. Only 5.4% voted for Trump and 4.6% voted for another candidate or didn't vote.
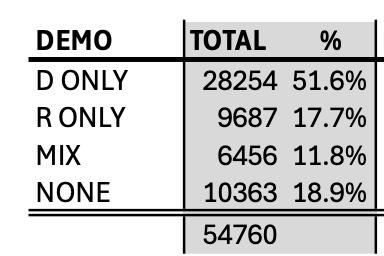
It's safe to say the Prop Q electorate will be far Trumpier than that. It's impossible to know exactly how much so ... but according to early vote data shared with me by longtime local operative Mark Littlefield, 17.7% of those who have voted so far have voted in Republican primaries in the past. Another 11.8% have voted in both party primaries.
Like I said before, mine is not a scientific poll. But it is another strong anecdotal signal to me that Prop Q is more likely than not to fail. I think it will likely win among Democrats but not by a large enough margin to survive the near-universal opposition from Austin's conservative minority.
Logo-gate & Salad-gate
I also asked readers how much their vote was affected by coverage of the city logo and/or the reporting on City Council members and the city manager taking liberties with their city credit cards. This was actually only supposed to be for people who are voting against Q, but some supporters ended up voting on it anyway:
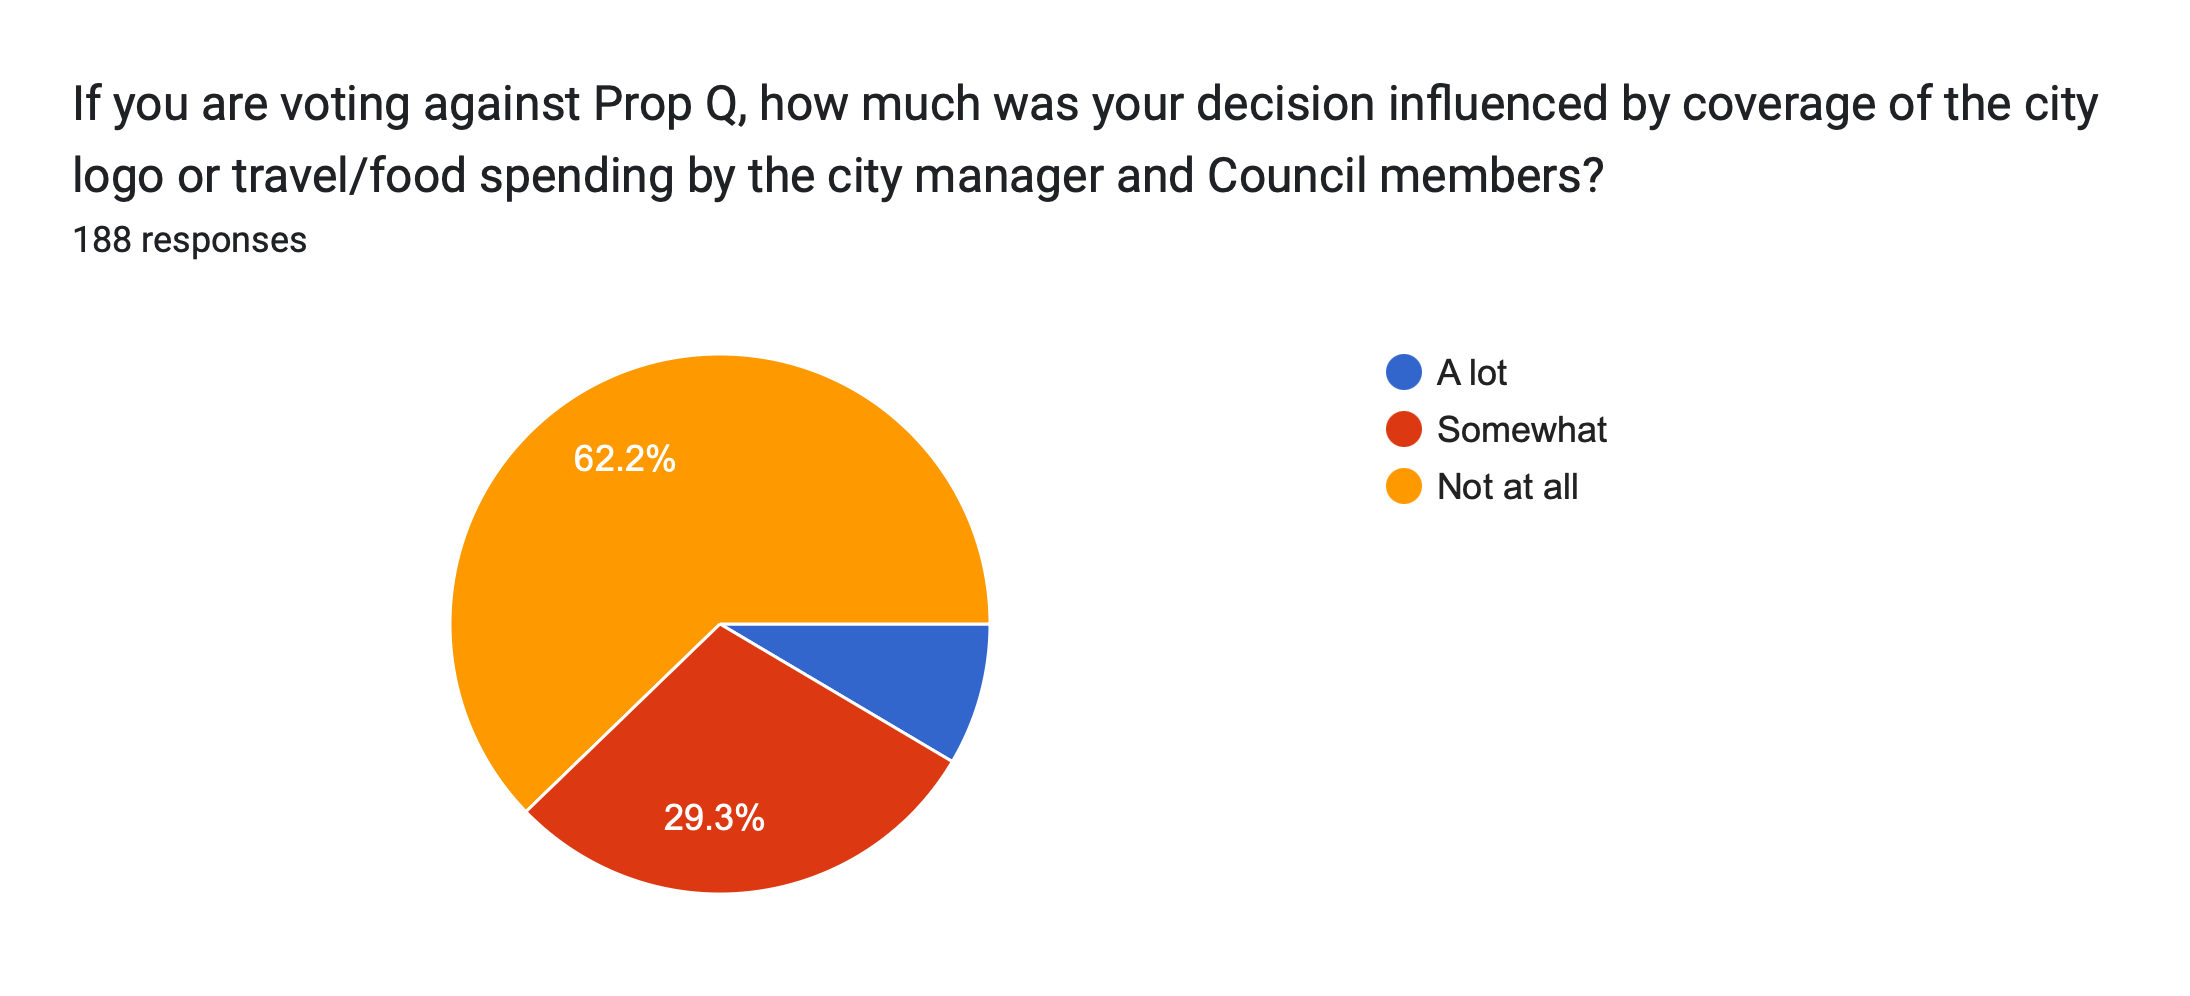
62.2% said it didn't influence their vote at all, 29.3% said they were somewhat influenced by it and 8.5% said they were greatly influenced it.
Mayor Kirk Watson's report card:
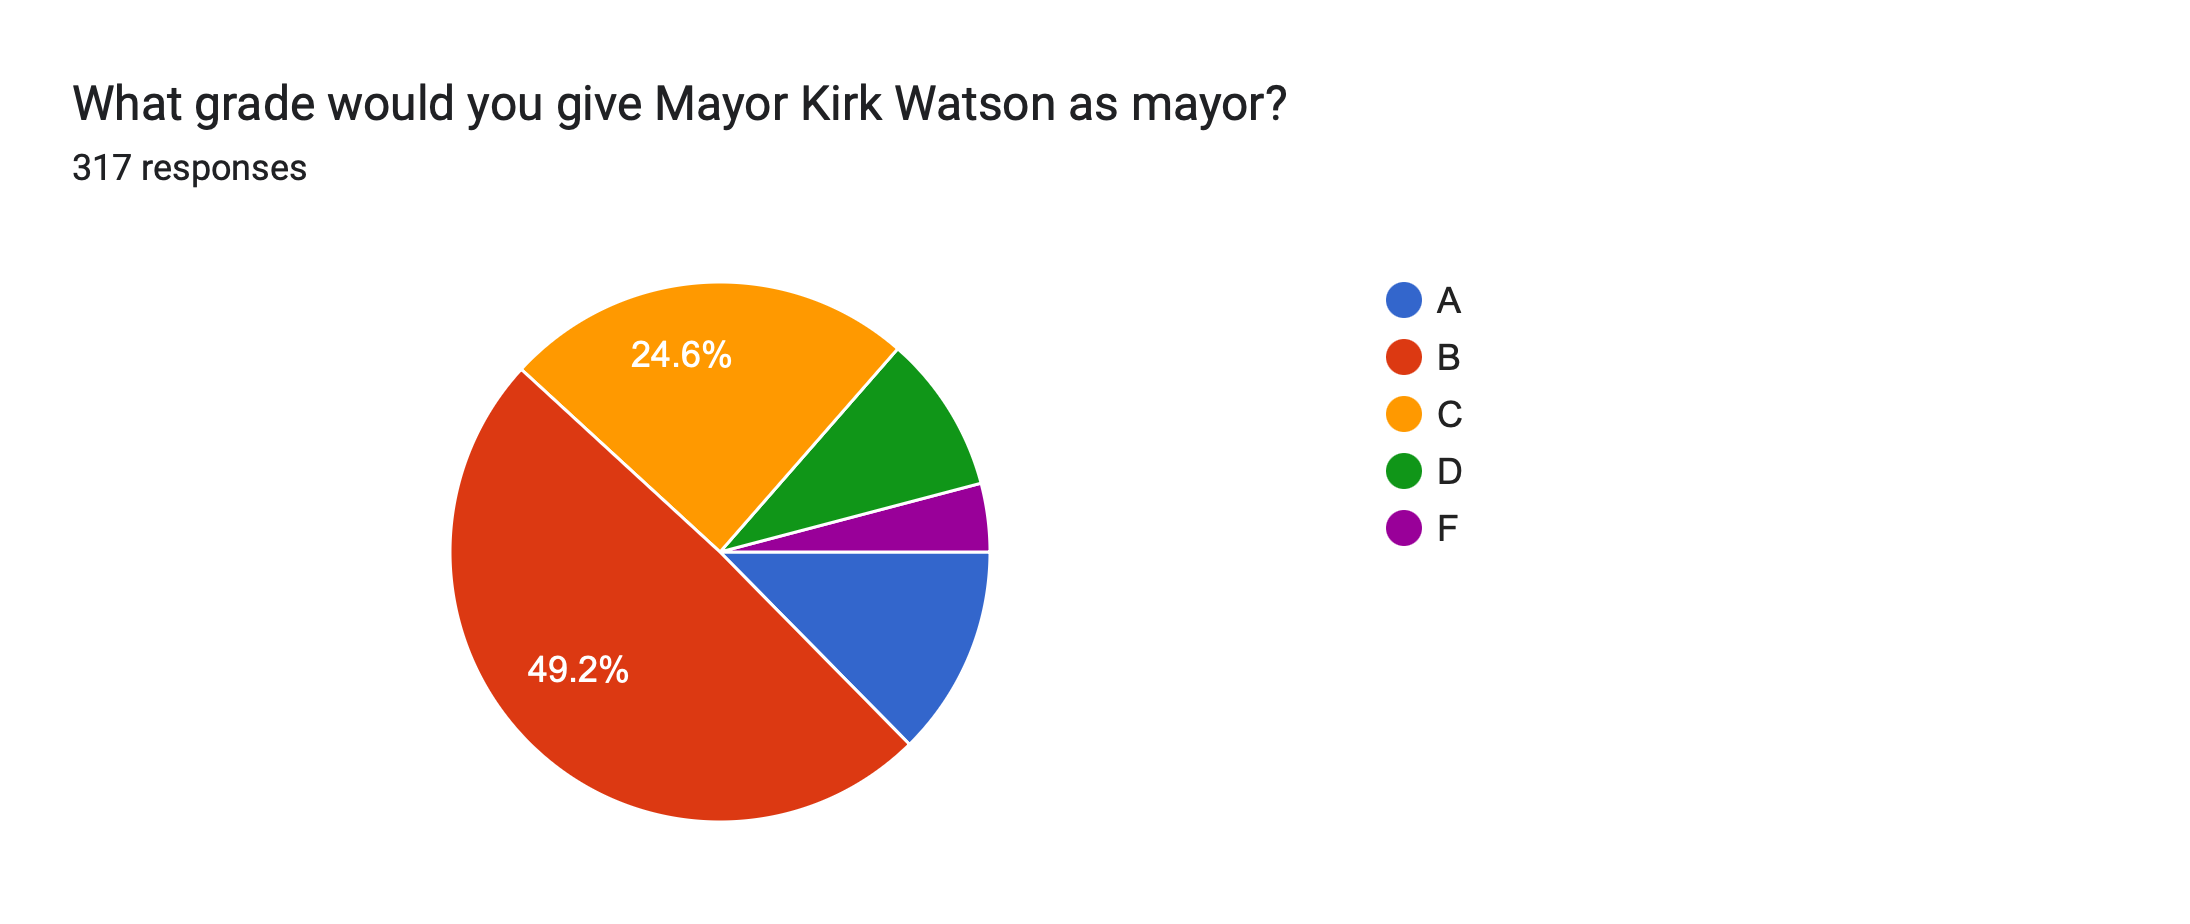
12.5% gave Watson an A; 49.2% gave him a B; 24.6% gave him a C, 9.7% gave him a D; and 4.1% gave him an F.
That sounds about right. Few are in love with the mayor, but equally few detest him.
If you were forwarded this email, please visit the website to sign up for more daily insights on city politics and government.